|
|
|
|
|
|
|
|
|
|
|
|
The Cartesian compression method is a novel patented image compression method specifically designed for document image storage and transmission systems.
The invention allows for the storage of documents in a fraction of the space that would be required when using today's best alternative technology. For instance, randomly selected documents have been compressed 20 to 30 times smaller than the industry-standard CCITT Group 4 compression method. Results across a broad spectrum of documents indicate that improvement of 10 to 1 over the Group 4 method is quite common. Based on these findings, whereas a 1 megabyte floppy disk can hold only a single uncompressed page image at 300 DPI, or perhaps images of a short report if compressed with Group 4, our compression method frequently allows page images of an entire book to be stored on a single floppy disk. The advantage for optical disks is commensurate.
In this document, we provide a high-level description of the
methodology and performance of the Cartesian compression method.
Document Processing and Image Quality
Document image processing devices, such as facsimile machines and document image storage or management systems, operate through a two-stage process. First, document images are digitized by a scanning device, generating a large bitmap. At 300 dots per inch (DPI) resolution, a letter-size page will comprise some one million bytes of data. Because of the large quantity of data thus derived, a second stage of compression is typically applied to the image. When the process is reversed through decompression and printing, the resulting image is not identical to the original because the scanning process introduces quantization error. The error introduced by the two-stage process can be easily seen by comparing an original document sent by low-resolution facsimile to the received version. However, this error, especially at resolutions of 300 DPI and above is typically not perceptually damaging.
Thus, document processing inevitably introduces some error into the image, regardless of whether the second-stage compression method itself introduces any error. As long as the overall error is perceptually benign, this is not a problem. Indeed, the compression stage itself could introduce error, as long as there are no perceptible artifacts of this error.
We can therefore divide image compression methods into two major classes:
It is, of course, crucial to use a nondegrading method for document image processing applications. Degrading methods, such as those based on eliminating high-frequency information (smoothing methods, discrete cosine transform methods such as JPEG, etc.) are not appropriate, as the process of compression and decompression perceptibly degrades the image beyond the degradation introduced by the digitization process itself. Repeated rounds of compression and decompression with such methods can further degrade the image.
Historically, most document image processing devices have achieved nondegrading compression by using a lossless method such as CCITT Group 3 or Group 4 compression described in CCITT Recommendations T.4 and T.6. Group 3 coding involves static Huffman coding of a run-length coding of the image. A two-dimensional variant (Group 3 2D) allows for alternate rows of pixels to be coded differentially from the previous row. Group 4 specifies, inter alia, differential coding for all rows. A more recent proposal for lossless binary image compression is IBM's patented Q-coder algorithm, which forms the basis of the JBIG draft proposal currently being developed by CCITT. The Q-coder uses arithmetic coding based on dynamic local modeling of pixel contexts.
Research on lossless image compression methods has made slow progress over the years. The four methods mentioned above have shown a steady progression of improvement, each method gaining on the order of tens of per cents over the previous method. For example, Table 1 shows compression ratios of the various standard methods for CCITT test page 1, the most widely used of eight standard test pages specified by CCITT.
| Compression method | Size (bytes/page) | Compression ratio |
|---|---|---|
| Uncompressed | 1120000 | -- |
| Group 3 1D | 59106 | 18.9 : 1 |
| Group 3 2D | 44954 | 24.9 : 1 |
| Group 4 | 24638 | 45.5 : 1 |
Group 3 2D is thus 30 per cent better than the 1D variant; Group 4 improves compression by another 80 per cent. Published reports show that the JBIG method provides an additional 20 per cent improvement over CCITT Group 4.
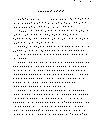
Since the scanning process itself introduces some error, there is no reason for preferring a lossless method over some other nondegrading method. Until now, however, nondegrading methods for image compression have not been available. Cartesian Products has demonstrated, however, that there are dramatic advantages in compression ratio that are achievable with nondegrading methods. Compare the original of CCITT 1 and the version compressed by Cartesian's method and then decompressed. Note that there is no perceptible distinction between the reconstructed image and the original. (The small labels in the upper right of each page are added by our software. Because the original and reconstructed images are so nearly identical, we add these labels to allow distinguishing the two.)
Since the Cartesian compression method is nondegrading, repeated compressions and decompressions do not further degrade the image. In fact, after only a few rounds of compressing and decompressing the image, the image reaches a steady state which remains unmodified by further rounds of compression. For the CCITT test page, this steady state is achieved after just two rounds. The reconstructed steady state image is shown here.
The Cartesian compression method can achieve far superior compression ratios as compared to the standard lossless methods. Table 2 extends Table 1 to include Cartesian's method.
| Compression method | Size (bytes/page) | Compression ratio | Cartesian advantage |
|---|---|---|---|
| Uncompressed | 1120000 | -- | 188.1 : 1 |
| Group 3 1D | 59106 | 18.9 : 1 | 9.9 : 1 |
| Group 3 2D | 44954 | 24.9 : 1 | 7.6 : 1 |
| Group 4 | 24638 | 45.5 : 1 | 4.1 : 1 |
| Cartesian | 5954 | 188.1 : 1 | -- |
As exhibited in the table, Cartesian's compression ratio of 188 to
1 is more than four times better than the CCITT Group 4 method, and
almost ten times better than the most widely used facsimile
compression method, Group 3 1D. Indeed, compression ratios of 20 to 1
over Group 4 and higher have been achieved by the Cartesian
compression method. Further examples will be provided in later
sections of this document.
Image Modeling and Compression Ratios
In this section, we discuss why the Cartesian method achieves higher compression than other image compression methods.
Data compression methods rely on removal of predictable structure from a data stream. If any portion of the data stream is predictable, that portion need not be stored. The degree of compression is therefore dependent on having a good model of prediction for the data to be compressed. All data compression methods include such a model, at least implicitly.
For example, the Group 3 method incorporates a model of document images under which images are predicted to be composed of runs of pixels whose lengths are distributed according to a static probability distribution. This probability distribution was determined empirically by CCITT on the basis of analyzing the eight standard CCITT test pages, of which previous figures have shown test page 1. (Thus the CCITT methods are, unlike Cartesian's method, tuned to work especially well on these eight images.)
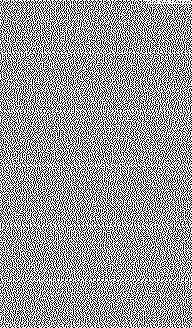
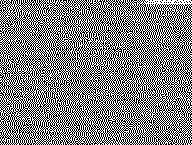
This model of binary images is not particularly representative of document images. There is a simple method of demonstrating when a model does not predict the structure of a document well: We can examine the data resulting from compressing an image as if it were itself an image. Since the human visual system is extremely sensitive to patterns in data, remaining structure in this compressed data will be visible as patterns in the printed image. Thus, any visible structure in this ``pseudo-image'' is evidence that the compression model used did not extract all possible structure from the original image data.
 |
 |
 |
| Group 3 | Group 4 | Cartesian |
Table 3 shows the pseudo-images for CCITT test page 1 as compressed by three different compression methods. The size of each image rectangle (relative to the original A4 image size) is a graphical depiction of the amount of compression achieved by the corresponding compression method. Note especially the large degree of structure in the Group 3 image, visible as both horizontal stripes and horizontally repeated patterns.
The pseudo-image rectangle under Group 4 compression is, of course, smaller by a factor of about two, because Group 4 compresses the image better than Group 3 by this factor. The amount of structure remaining in the image is certainly less than that in the Group 3 pseudo-image, providing evidence that the Group 4 model is a better model of the original image than the Group 3 model. This is because the Group 4 model, unlike the Group 3 model, assumes that the patterns of runs will be similar from one row of pixels in the image to another.
The Cartesian image model is based on novel pattern analysis technology. The model assumes that patterns in the image tend to be mutually similar and to recur. Thus, by predicting new patterns from old ones, strong expectations, and therefore better compression, can be achieved. The pattern analysis model is based on an underlying model of perceptual discriminability. Patterns that are indiscriminable may be treated as redundant, thereby achieving greater compression. Because the model takes into account perceptual factors, the reconstructed image is perceptually indistinguishable from the original.
The third pseudo-image in Table 3 shows the CCITT test page 1 again, this time after compression by Cartesian's method. The advantage of Cartesian's model of document images can be readily seen in the image, which is essentially completely random. All visible structure has been removed. The size of the rectangle is, of course, related to the superior compression ratio for this document.
Similar images of the Group 3, Group 4, and Cartesian compressed data for a six-page legal document (discussed further in the next section) are given in Table 4. In this case, the remaining structure in the Group 3 image is even sufficient to determine the number of pages in the original, as the five page boundaries are perceptually distinguishable in the image. Again, the Cartesian image is essentially random, demonstrating that the Cartesian model of document images is more effective for this document.
 |
 |
 |
| Group 3 | Group 4 | Cartesian |
The pattern analysis technology used in Cartesian compression is
based on recognizing patterns in documents. As documents increase in
length, the pattern analysis performed on previous pages can be
applied to later pages thereby allowing for better compression.  Thus, Cartesian compression
exhibits a kind of learning curve. As documents get larger,
compression ratio increases. As an example, we consider a six-page legal document. In order to
verify the nondegrading nature of the compression, we exhibit the
reconstructed images there as well.
Table 5 shows compression
ratios for the six-page legal document as compressed by the standard
methods in comparison with Cartesian's method. As the table shows,
Cartesian's method is more than 20 times that of Group 4 and almost 50
times that of Group 3 1D.
| Compression method | Size (bytes/page) | Compression ratio | Cartesian advantage |
|---|---|---|---|
| Uncompressed | 1056000 | -- | 610.9 : 1 |
| Group 3 1D | 84099 | 12.6 : 1 | 48.7 : 1 |
| Group 3 2D | 63419 | 16.7 : 1 | 36.7 : 1 |
| Group 4 | 37326 | 28.3 : 1 | 21.6 : 1 |
| Cartesian | 1728 | 610.9 : 1 | -- |
In part, these dramatic compression ratios rely on the learning ability of the method. Table 6 shows Cartesian's compression ratios for the first one page of this document, the first two pages, the first three pages, and so forth. Note that the compression ratio rises as the document length increases. A graphical depiction of these results shows the increase in compression ratio as each page is added.
| Compression method | Compression ratios for page(s) | |||||
|---|---|---|---|---|---|---|
| 1 | 1-2 | 1-3 | 1-4 | 1-5 | 1-6 | |
| Group 3 1D | 12.96 | 12.34 | 12.42 | 12.15 | 12.23 | 12.55 |
| Group 3 2D | 17.14 | 16.35 | 16.46 | 16.11 | 16.21 | 16.65 |
| Group 4 | 29.13 | 27.66 | 27.90 | 27.26 | 27.46 | 28.29 |
| Cartesian | 324.72 | 433.50 | 485.67 | 533.27 | 574.48 | 610.93 |
The document image model for a compression method implicitly provides a probability distribution over the possible images. To the extent that the stream of actual images to be compressed matches this distribution, the compression method will perform well. As we have seen, Cartesian's pattern analysis model matches the CCITT test page 1 image and the legal document image much better than the CCITT models do. There is always a danger, however, that by strengthening the model -- tuning it more closely to a particular class of images -- that the model will actually be less applicable to useful images outside the class.
This problem of ``overfitting'' a compression model can be seen in the Group 4 compression method. The Group 3 method makes no assumptions about the relation between two rows of pixels in an image. In many document images, however, especially those that are images of text, each row of pixels is quite similar to the previous row. For this reason, the Group 4 compression method was devised. Essentially, it allows only the differences between two rows to be stored, rather than the rows themselves. Implicitly, it assumes a model of images in which adjacent rows are similar.
 This model is considerably
better as a model of text images, as we have seen in the case of the
CCITT test page and the legal document. However, for many quite
reasonable document images, this model is too strong. As an example,
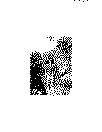
we consider a halftoned
photograph. The Group 3 compression method achieves a compression
ratio of 4.9 to 1 on this image, whereas the Group 4 method achieves
only 4.4 to 1. (See Table 7.) The Group 4 method is thus inferior to
the Group 3 method for this image, because the model is too closely
attuned to images with strong vertical redundancy.
| Compression method | Size (bytes/page) | Compression ratio | Cartesian advantage |
|---|---|---|---|
| Uncompressed | 1056000 | -- | 23.3 : 1 |
| Group 3 1D | 217462 | 4.9 : 1 | 4.8 : 1 |
| Group 3 2D | 197746 | 5.3 : 1 | 4.4 : 1 |
| Group 4 | 240577 | 4.4 : 1 | 5.3 : 1 |
| Cartesian | 45367 | 23.3 : 1 | -- |
A natural worry with a method that displays such good compression ratios as the Cartesian method is that it might also be overfitted to particular images or image types. Certainly, the compression ratios exhibited by Cartesian compression vary depending on the image characteristics. It shares several properties with Group 4 as to what image characteristics are optimal.
Unlike Group 4, however, the method displays the following characteristics.
Nonetheless, even with these characteristics in mind, the performance of Cartesian compression on this same photograph image that was problematic for Group 4 shows that the method is at least broad enough to encompass photographs well. The Cartesian method achieves more than a five-fold improvement in compression over the Group 4 method for this image, as shown in Table 7. The reconstructed image demonstrates that the Cartesian method does not degrade the image quality of the original at all.
In our extensive testing of the method on a variety of
document types, we have yet to find a document for which Cartesian
compression does not provide better compression than the CCITT Group 3
and Group 4 methods.
Speed and Memory Performance
Our current version of the compression system is designed to run interoperably on multiple computer architectures, and has already been qualified on several architectures including SPARC, MIPS, Motorola 680x0, and Intel x86 running under UNIX and Windows. The system requires no special hardware and only one megabyte of memory. Versions configured for running in even less memory have been built; they exhibit a minor loss in compression.
For an image compression method to be useful, documents must be
able to be compressed reasonably efficiently. On a 25 megaHertz 68040
processor, our implementation typically requires three to four seconds
to compress a 300 DPI page, and one to two seconds for decompression.
On a fast Pentium, sub-second per page times are typical for
compression and decompression.
Additional Sample Documents
The sample documents described in this technical overview are provided
in both original and Cartesian-compressed and reconstructed forms in
an appendix. Performance statistics are
included in the appendix as well.
| © 1998-1999 Cartesian Products, Inc. | Contact Cartesian |